A Quick Lesson on Divergences
A quick lesson on “Divergences”
A term we hear often, but what is a divergence when it comes to trading? The recent price action in LINK/BTC is a good example of a bearish-divergence. What is divergence? Simply put, a divergence refers to a situation where different technical indicators fail to confirm one another. More importantly, when the indicators fail to confirm the PRICE ACTION, which I frequently argue is the most important thing to consider when trading. Indicators are simply there to help you confirm what you believe you are seeing… but that’s another rant for another day.
As will all setups and indicators, the higher the time frame, the more reliable the signal (to a point.) In this example, I’m using the Daily chart of LINK/BTC. I’m using the RSI and MACD here but regardless of which oscillator you choose, one of the most important signals they provides is a divergence between the oscillator and the price action at the extremes. For example, in the chart below we see LINK/BTC has a powerful 145% gain over three weeks. It then pulls back for a week before heading higher in another 36% move up. At the first price peak, the RSI hits an extreme near 87. However, during the second price peak, the RSI can only get to 77. That is a bearish divergence – higher-high on the price but a lower-high on the RSI. The same scenario shows up on the MACD-histograms.
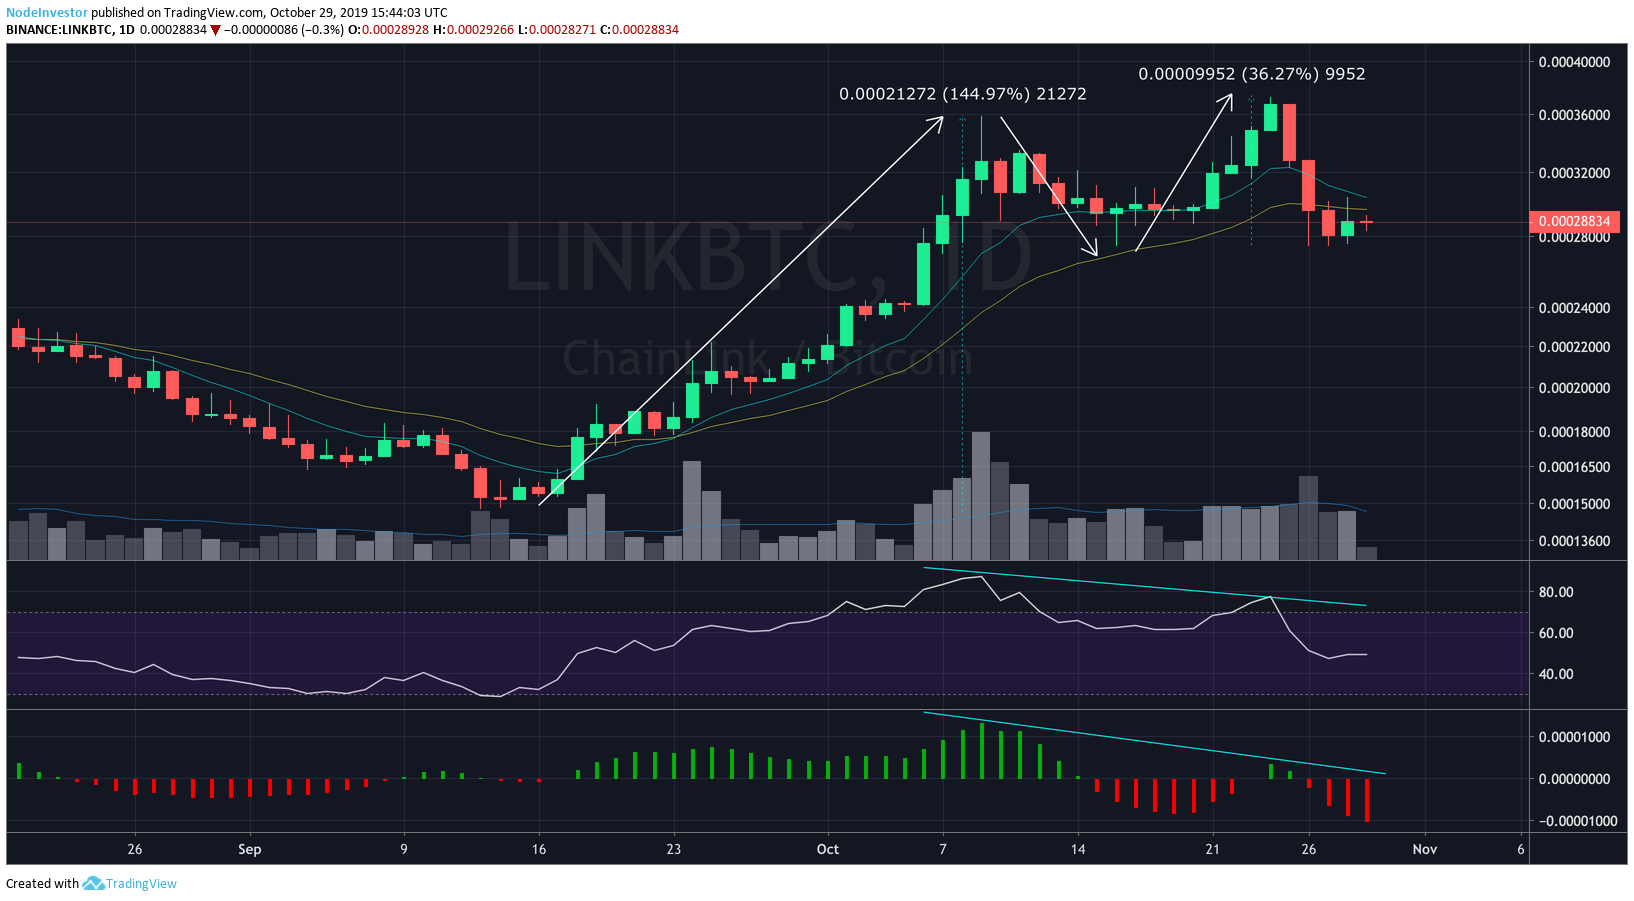
These divergences are not an automatic sell-signal but they are a red flag that screams “pay attention”. When I see these on one of my trades, I will often take partial profits or tighten the stops. Usually a combination of the two. It’s also important to note that the divergence is not “confirmed” until after prices starts to retreat again so they are often hind-sight which is why I take a proactive approach to locking in some gains while keep part of the trade open in case it continues higher and negates the potential divergence. The big bearish reversal candle at the top of the second peak would be enough for me to take the rest off but a trader could have also waited for either the moving averages to be breached or for a price support level to be lost.
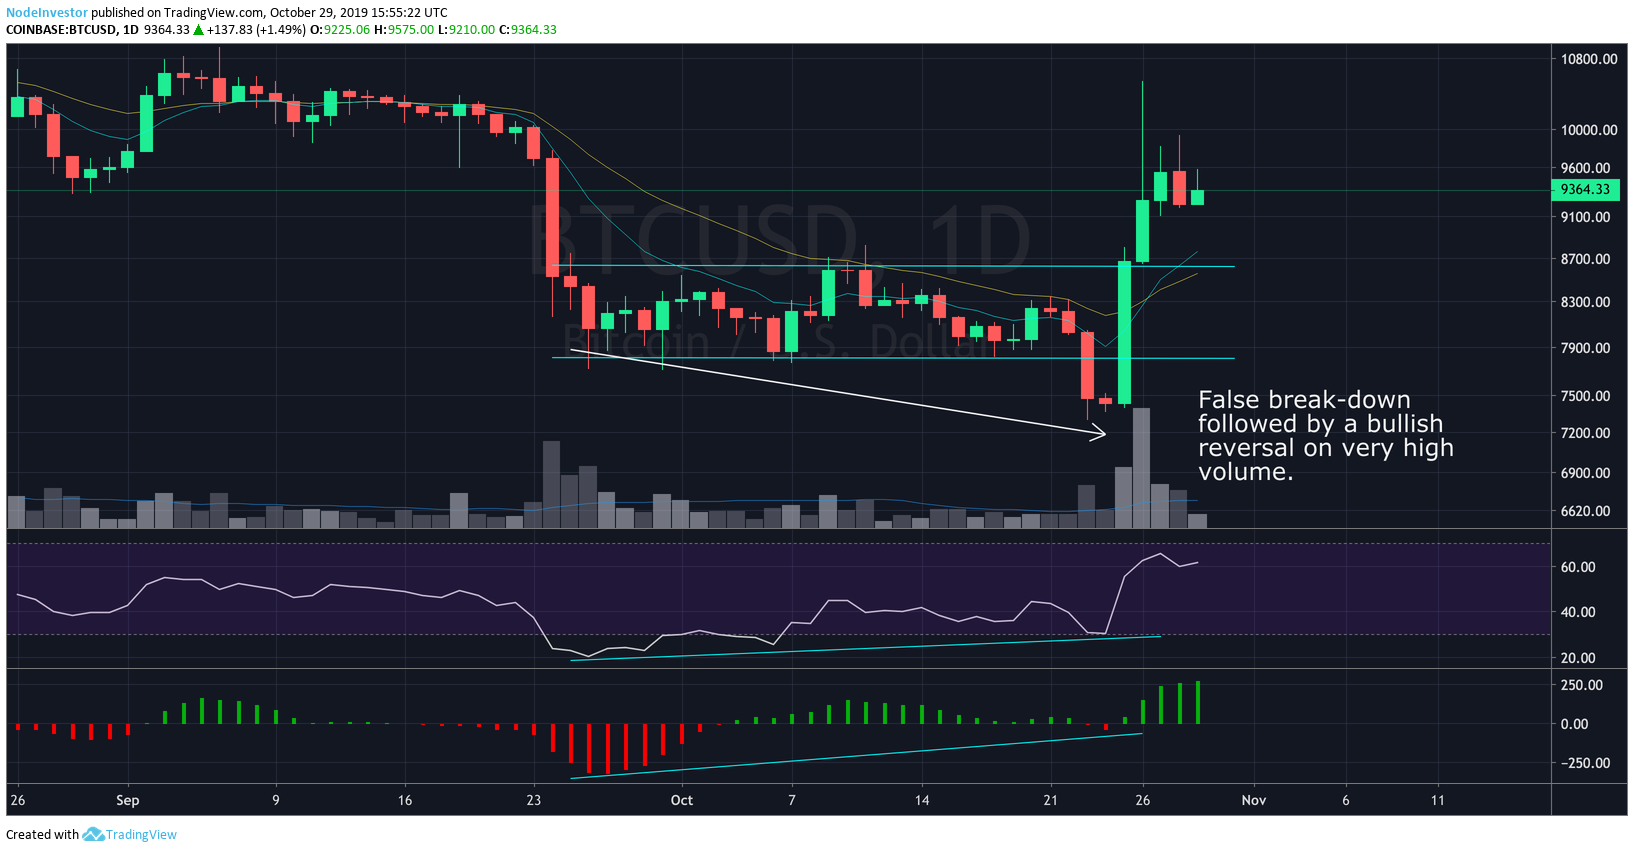
On the opposite side, we recently saw a combination of a Bullish Divergence and false breakdown in Bitcoin before it had a massive reversal higher. This also happened to come at a point of extreme bearish sentiment after it had already fallen 45% since June and when it was at a key support level. Bear trap!